- Tax Planning Strategies: How to Master Effective Tax Planning
- Cash Flow Projection: Real Cash Flow Projection
- The Importance of Cash Flow for Businesses
- How to Evaluate the Financial Health of a Startup
- Analyzing Cash Flow from Investing Activities
We have designed 450+ Financial Model Templates Designed in Excel or Google Sheet for different companies which are ready to use and you just need to type the inputs in the yellow cells and you will get the desired financial model. You can also check E-Commerce Financial Model Templates , Food and Beverage Financial Model Templates , Hospitality Financial Model Templates .
After reading this article, you should be Apple to learn:
- What are financial performance ratios?
- Commonly used financial performance ratios
- FREQUENTLY ASKED QUESTIONS
What are financial performance ratios?
Financial performance ratios are ratios that explain the performance of the business which is effectively the managed investment to provide higher returns to stakeholders and to the business itself. Generally, Return Ratios Compare the tools available to generate the profit, for example, investment in stocks or assets to net income
Commonly used financial performance ratios
There are different financial performance ratios that can be used by the company. Some of these important ratios are explained below with their pros and cons:
- Return on capital employed (ROCE) is an important financial ratio used by different companies to assess their performance. It guides the business on how it is doing in the means of generating profit from its capital. It also gives an idea of the efficiency of capital that can be allocated, which can have a direct impact on business profitability. The return on capital ratio is also known as the book rate of return (ARR).
Here are the advantages of ROCE:
- Simplicity: ROCE is based on the widely reported measures of performance (earnings) and assets (Statement of Financial Values), it is easily understood and easily calculated.
- Link to other accounting measures: Annual ROCE calculated to value a company or a sector of a company (and therefore the investment decision made by this company), is a widely used measure. It is expressed as a percentage of terms with which managers and accountants are familiar.
- Timing of investment: does not take into account the lifetime of the investment or the timing of the yield of the lifetime of that investment. This therefore ignores the time value of money.
- Specific accounting policies: Companies’ accounting policies vary and ROCE depends on the extent to which investment costs are capitalized. Profit measurement is therefore subjective and ROCE figures for identical investments would vary from business to business.
- Not an absolute gain: Like all rate of return measures, this is not a measure of the absolute gain in wealth for the business owner.
- Internal rate of return (IRR)
represents the discount rate at which the NPV of an investment is zero. As such, it represents an equilibrium cost of capital. It can also be defined as the compound annual rate of return of IRR that can be earned on a project or investment.
The IRR of the project investment can be calculated as below:
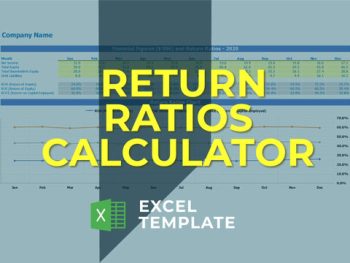
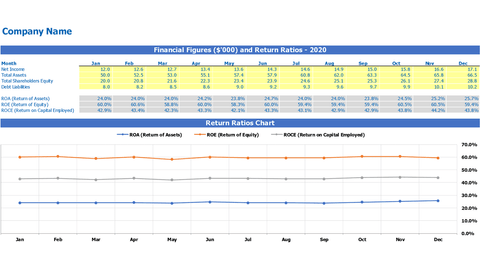
IMPORTANT NOTE: We have designed free Return Ratios Excel Template Calculator where you just need to create a copy of the sheet and put your numbers in the yellow cells and see the return ratios over a period as well as graphical trends . You can also try Financial Dashboard .
Download Ratios Ratios Excel Template Calculator in Excel
Download the Excel template ⟶
FREQUENTLY ASKED QUESTIONS
Q. Which financial performance report is most widely used?
A. The IRR is most widely used to assess or evaluate future projects; However, leading companies are primarily assessed using ROCE and ROE.
Q. How can a company improve its ROCE or ROE?
A. Since the ROCE or ROE formula used earnings, so any measure that improves earnings would result in better ratios. These measures may include increasing sales, improving operational efficiency to reduce costs, or paying down debt to reduce interest expenses. A well-streamlined capital structure can also lead to an increase in ROCE or ROE.
Q. What is the main difference between ARR & IRR?
A. ARR uses accounting profit to calculate the percentage return generated by invested capital, while IRRs essentially use cash flow to calculate a rate where the NPV of a project becomes zero.
[right_ad_blog]
leave a comment
Your email address will not be published. Mandatory fields are marked *
Please note that comments must be approved before they will be published.
#shopify-section-article-template>div:first-child,#comments >.comment:last-child {margin: 0}
#shopify-section-article-template>div:last-of-type {margin-bottom: 60px}
#CommentForm-body {min-height: 230px}
.comment__content p {margin-bottom: 5px}
.col_avatar_cm {padding-right: 5px}
.rtl_true .col_avatar_cm {padding-right: 0;padding-left: 5px}
.blog-navigation a {font-size: 40px}
.social_des_2 .nt-social a {
width: 32px;
height: 32px;
line-height: 32px;
border-radius: 50%;
background: #000;
color: #fff;
}


