The Complete Rental Property Cash Flow Guide for 2026
Cash flow matters because it provides immediate, predictable income that covers your mortgage, taxes, insurance, and maintenance while still putting money in...
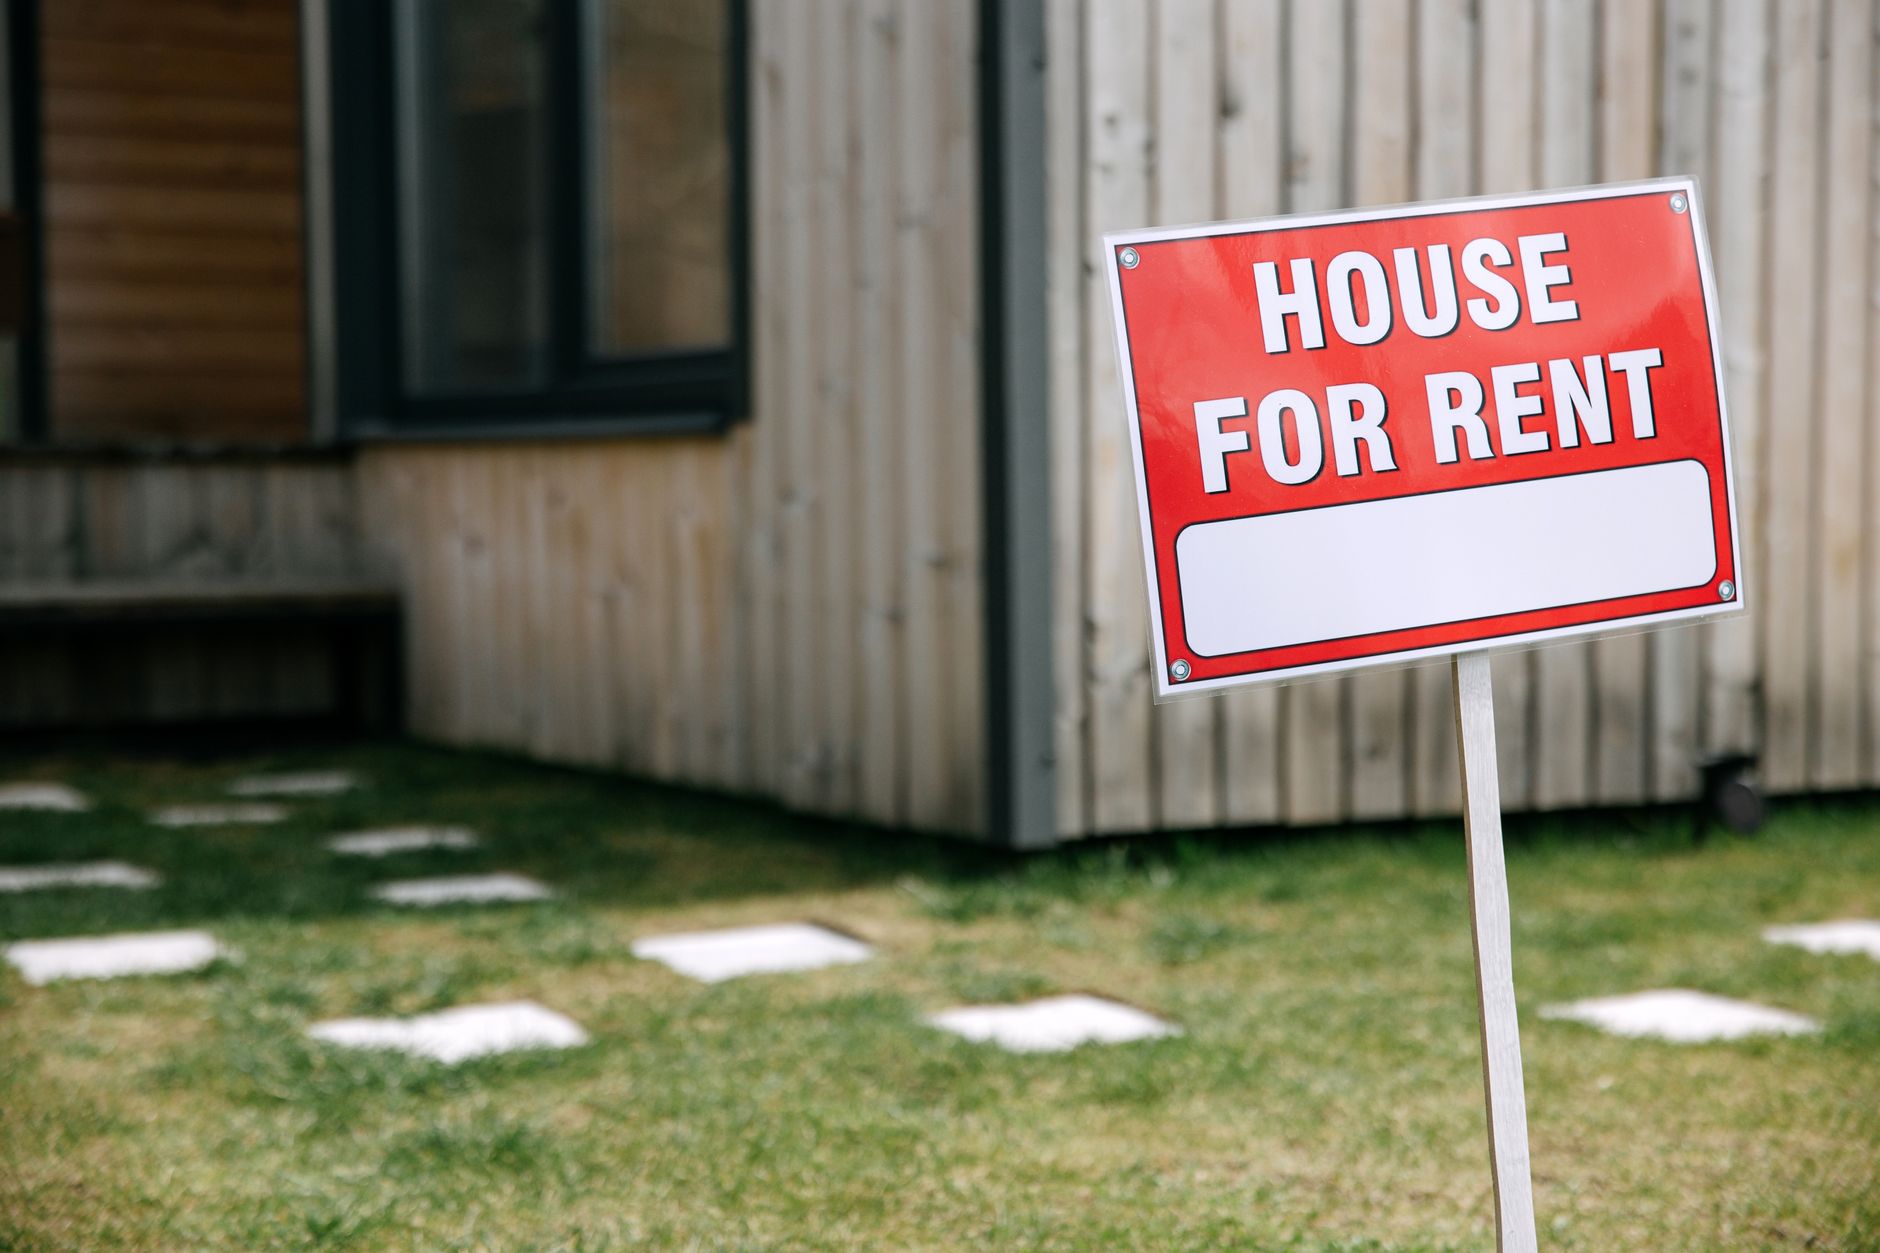
The Complete Rental Property Cash Flow Guide for 2026
Quick Answer: Yes, rental property cash flow is the net income remaining after all operating expenses and debt payments are subtracted from rental income. As of July 2026, the average single-family rental property in the U.S. generates between $200 and $600 per month in positive cash flow, according to data from the National Association of Realtors. Understanding and accurately calculating cash flow is the single most important skill for building sustainable wealth through real estate investing.
Table of Contents
- What Is Rental Property Cash Flow and Why Does It Matter?
- How Do You Calculate Rental Property Cash Flow Accurately?
- What Is the 1% Rule and Does It Still Work in 2026?
- How Much Cash Flow Should You Expect From a Rental Property?
- What Are the Biggest Mistakes That Kill Rental Property Cash Flow?
- How Can You Increase Cash Flow on an Existing Rental Property?
- Should You Use Leverage to Improve Cash Flow?
- What Tools and Formulas Help Track Cash Flow Over Time?
What Is Rental Property Cash Flow and Why Does It Matter?
Rental property cash flow is the money left over each month after you've collected rent and paid all expenses. In my practice as a CPA specializing in personal tax strategy, I've seen countless investors focus solely on appreciation while ignoring cash flow—a mistake that has cost them dearly during market downturns.
Cash flow matters because it provides immediate, predictable income that covers your mortgage, taxes, insurance, and maintenance while still putting money in your pocket. According to a 2025 study by the Federal Reserve Bank of Atlanta, properties with positive cash flow experienced 40% lower foreclosure rates during economic downturns compared to negative cash flow properties.
The cash flow formula is straightforward:
- Total Rental Income
- Minus: Vacancy Loss (typically 5-10%)
- Minus: Operating Expenses (property taxes, insurance, HOA fees, repairs, property management)
- Minus: Mortgage Payment (principal and interest)
- Equals: Net Cash Flow
Why Cash Flow Beats Appreciation for Most Investors
Cash flow provides stability that appreciation cannot guarantee. When I advised clients during the 2022 market downturn, those relying on appreciation saw their portfolios drop 15-20% in value, while cash-flowing properties continued generating income regardless of market conditions.
Appreciation is speculative—you cannot control it. Cash flow, however, is directly influenced by your management decisions, property selection, and expense control. As of 2026, the average annual appreciation rate for residential real estate is 3.5% according to CoreLogic, while well-selected cash-flow properties can yield 8-12% annual returns on cash invested.
How Do You Calculate Rental Property Cash Flow Accurately?
To calculate rental property cash flow accurately, you must account for all income sources and every possible expense, including non-monthly costs like capital expenditures. The most common mistake I see is investors underestimating expenses by 30-40%, which leads to overestimating cash flow.
Step-by-Step Cash Flow Calculation:
- Calculate Gross Rental Income: Monthly rent × 12 months
- Subtract Vacancy Allowance: 5-10% of gross income (use 8% for conservative estimates)
- Add Other Income: Laundry, parking, storage fees, pet rent
- Subtract Operating Expenses:
- Property taxes (typically 1-2% of property value annually)
- Insurance ($800-$2,000 annually depending on location)
- HOA fees ($100-$500 monthly)
- Property management (8-12% of collected rent)
- Repairs and maintenance (1-2% of property value annually)
- Utilities (if landlord pays)
- Capital expenditures reserve (10-15% of rent)
- Subtract Debt Service: Monthly mortgage payment (principal + interest)
- Result: Annual net cash flow ÷ 12 = Monthly cash flow
The 50% Rule vs. Actual Expense Tracking
The 50% rule suggests that operating expenses (excluding mortgage) will consume 50% of your gross rental income. While this rule provides a quick screening tool, it's imprecise.
| Expense Category | 50% Rule Estimate | Actual National Average (2026) |
|---|---|---|
| Property taxes | 15% of income | 12-18% depending on location |
| Insurance | 5% of income | 4-7% for single-family homes |
| Maintenance/Repairs | 15% of income | 10-15% for newer properties |
| Property management | 10% of income | 8-12% for professional management |
| Vacancy | 5% of income | 3-8% depending on market |
| Total Operating Expenses | 50% of income | 40-55% of income |
Source: National Association of Residential Property Managers, 2026 Annual Survey
In my experience, newer properties (less than 10 years old) tend to fall at 40-45% of income, while older properties (20+ years) can reach 55-60%.
What Is the 1% Rule and Does It Still Work in 2026?
The 1% rule states that a rental property should generate monthly rent equal to at least 1% of its purchase price. For example, a $200,000 property should rent for $2,000 per month. As of July 2026, this rule is increasingly difficult to achieve in major metropolitan areas, where average rent-to-price ratios have fallen to 0.5-0.7%.
The 1% rule is best used as a screening tool, not a definitive measure of cash flow. In my practice, I've found that properties meeting the 1% rule in 2026 are typically in B- to C-class neighborhoods in secondary markets like Indianapolis, Memphis, or Cleveland.
Alternative Cash Flow Screening Metrics
| Metric | Formula | Target Range (2026) | Best For |
|---|---|---|---|
| 1% Rule | Monthly rent ÷ Purchase price | ≥ 1% | Quick screening |
| Cash-on-Cash Return | Annual cash flow ÷ Total cash invested | 8-12% | Evaluating leverage |
| Cap Rate | Net operating income ÷ Property value | 6-10% | Comparing properties |
| Gross Rent Multiplier | Property price ÷ Annual gross rent | 8-12 | Quick value assessment |
The 2% rule (rent equals 2% of purchase price) is virtually impossible in 2026 except for distressed properties or multi-unit buildings in tertiary markets. Focus instead on achieving a cash-on-cash return of 8-12% after all expenses.
How Much Cash Flow Should You Expect From a Rental Property?
In 2026, a well-selected rental property should generate $200-$600 per month in positive cash flow for a $200,000-$300,000 single-family home, assuming a 20-25% down payment. This translates to a 6-10% cash-on-cash return on your invested capital.
Cash Flow by Property Type (National Averages, Q2 2026)
| Property Type | Average Purchase Price | Average Monthly Rent | Average Monthly Cash Flow | Cash-on-Cash Return |
|---|---|---|---|---|
| Single-family (3BR/2BA) | $280,000 | $2,100 | $350 | 8.5% |
| Condo/Townhouse | $220,000 | $1,800 | $250 | 7.2% |
| Duplex (2 units) | $350,000 | $2,800 (total) | $500 | 9.1% |
| Small multi-family (4 units) | $500,000 | $4,200 (total) | $800 | 10.2% |
Source: Real Estate Investors Association National Benchmark Report, July 2026
Factors that significantly impact expected cash flow:
- Down payment size: 20% down vs. 30% down changes cash flow by $100-$300 monthly
- Interest rates: As of July 2026, 30-year fixed rates average 6.5%, impacting monthly payments by approximately $150 per $100,000 borrowed compared to 4% rates
- Property condition: Newer properties require less maintenance but cost more to acquire
- Tenant quality: Professional tenants in stable employment reduce turnover costs
What Are the Biggest Mistakes That Kill Rental Property Cash Flow?
The three biggest mistakes that destroy rental property cash flow are overestimating rent, underestimating expenses, and failing to account for capital expenditures. In my 12 years as a CPA, I've seen these errors turn seemingly profitable deals into cash-draining nightmares.
Mistake #1: Using Unrealistic Rent Estimates
Many investors use Zillow or Rentometer estimates without verifying them against actual comparable rentals. A 2025 study by the National Multifamily Housing Council found that online rent estimates are accurate within 5% only 60% of the time.
How to avoid this: Call 5-10 property managers in the area and ask what they're currently renting comparable properties for. Also check actual lease data from sites like RentData or local realtor MLS data.
Mistake #2: Ignoring Capital Expenditures
Capital expenditures (CapEx) include major replacements like roofs ($8,000-$15,000), HVAC systems ($5,000-$10,000), and water heaters ($800-$1,500). These are not monthly expenses but will occur.
The CapEx reserve rule: Set aside 10-15% of monthly rent for future capital expenditures. For a $2,000/month rental, that's $200-$300 per month. Over 10 years, this builds a $24,000-$36,000 reserve—enough for a roof and HVAC replacement.
Mistake #3: Over-Leveraging with High Debt Payments
When interest rates rise, cash flow can turn negative quickly. As of July 2026, a 1% increase in interest rates reduces cash flow by approximately $100 per month per $200,000 borrowed.
The 75% rule: Never let your total monthly housing payment (PITI: principal, interest, taxes, insurance) exceed 75% of your projected gross rent. This leaves a 25% cushion for vacancies, repairs, and management.
How Can You Increase Cash Flow on an Existing Rental Property?
You can increase cash flow on an existing rental property through rent optimization, expense reduction, and value-add improvements. In my practice, I've helped clients increase cash flow by 20-40% within 12-18 months using these strategies.
Rent Optimization Strategies
Annual rent increases are the simplest way to boost cash flow. According to the Bureau of Labor Statistics, market rents increased 4.2% year-over-year as of June 2026. If you're not increasing rent at least 3-5% annually, you're leaving money on the table.
Value-add improvements that justify higher rent:
- Updated kitchen countertops: Cost $2,000-$4,000, can increase rent $100-$150/month
- New flooring: Cost $3,000-$6,000, can increase rent $75-$125/month
- In-unit laundry: Cost $1,500-$3,000, can increase rent $75-$100/month
- Fresh paint and landscaping: Cost $500-$2,000, can increase rent $50-$75/month
Return on improvement calculation: If a $3,000 improvement increases rent by $100/month ($1,200/year), your ROI is 40% annually ($1,200 ÷ $3,000).
Expense Reduction Strategies
Refinancing at lower rates can significantly improve cash flow. If you purchased when rates were 7-8% and can refinance to 6.5%, on a $200,000 loan, you save approximately $150-$200 per month.
Self-managing vs. professional management: Self-management saves 8-12% of collected rent but requires significant time. For investors with 1-3 properties, self-management typically saves $150-$400 monthly per property.
Tax optimization through cost segregation can accelerate depreciation deductions, reducing taxable income from the property. A 2025 study by the American Institute of CPAs found that cost segregation studies typically increase first-year depreciation by 20-40%.
Should You Use Leverage to Improve Cash Flow?
Yes, strategic leverage can improve cash flow returns, but it also increases risk. As a CPA, I advise clients that leverage is a powerful tool when used conservatively—aim for a debt-to-income ratio on the property of 70-80% maximum.
Leverage Scenarios Compared
| Scenario | Down Payment | Monthly Cash Flow | Cash Invested | Cash-on-Cash Return |
|---|---|---|---|---|
| All cash | $250,000 | $1,200 | $250,000 | 5.8% |
| 50% down | $125,000 | $600 | $125,000 | 5.8% |
| 25% down | $62,500 | $250 | $62,500 | 4.8% |
| 20% down (with PMI) | $50,000 | $150 | $50,000 | 3.6% |
Assumes $250,000 property, $2,500/month rent, 50% operating expenses
Key insight: While cash-on-cash return decreases with higher leverage, your total return on equity (including appreciation and principal paydown) often increases. A 25%-down property might show lower cash flow but higher total returns when including 3-4% annual appreciation and 2-3% principal paydown.
When Leverage Makes Sense
Use leverage when:
- You can achieve a cap rate higher than your interest rate (positive spread)
- You have adequate cash reserves (6-12 months of expenses)
- The property is in a growing market with strong employment
Avoid leverage when:
- Interest rates exceed the property's cap rate by more than 2%
- You have less than 3 months of reserves after purchase
- The property requires significant immediate repairs
What Tools and Formulas Help Track Cash Flow Over Time?
The best tools for tracking rental property cash flow are accounting software, spreadsheets, and online platforms that automate income and expense tracking. In my practice, I recommend a combination approach for maximum accuracy.
Top Cash Flow Tracking Tools (2026)
| Tool | Best For | Cost | Key Features |
|---|---|---|---|
| Stessa | Individual investors | Free/Pro $120/year | Automated rent tracking, expense categorization, tax reports |
| QuickBooks Online | Portfolio management | $30-$100/month | Full accounting, 1099 preparation, bank feeds |
| Spreadsheet (Google Sheets) | Beginners | Free | Customizable, no learning curve, unlimited scenarios |
| Rentec Direct | Property managers | $45-$55/month | Tenant portals, maintenance tracking, accounting |
Essential Cash Flow Formulas to Monitor Monthly
Debt Service Coverage Ratio (DSCR): Net operating income ÷ Total debt service
- Target: ≥ 1.25 (means you have 25% more income than debt payments)
- Below 1.0 means negative cash flow
Cash-on-Cash Return: Annual pre-tax cash flow ÷ Total cash invested
- Target: 8-12% for single-family rentals
- Formula: (Annual cash flow ÷ Total down payment + closing costs + repairs)
Operating Expense Ratio: Total operating expenses ÷ Effective gross income
- Target: 40-55%
- Above 60% indicates a problem property
Vacancy Rate: Days vacant ÷ 365 days
- Target: Below 5% (18 days or less per year)
- Industry average: 5-8% for well-managed properties
Key Takeaways
- Rental property cash flow is the net income after all expenses and debt payments—aim for $200-$600 monthly per property in 2026
- The 1% rule is a screening tool, not a guarantee; focus on 8-12% cash-on-cash returns instead
- The biggest mistakes are overestimating rent, underestimating expenses, and ignoring capital expenditures—budget 10-15% of rent for CapEx
- Strategic improvements like updated kitchens and in-unit laundry can increase rent by $75-$150 monthly with ROIs of 30-50% annually
- Use leverage conservatively—maintain a DSCR above 1.25 and keep at least 6 months of cash reserves
Frequently Asked Questions
Question: What is a good monthly cash flow for a rental property? A good monthly cash flow for a rental property in 2026 is $200-$600 per single-family home after all expenses, which typically yields an 8-12% cash-on-cash return. Properties in secondary markets with lower purchase prices often produce higher cash flow relative to investment.
Question: How do I calculate rental property cash flow for taxes? For tax purposes, calculate cash flow as rental income minus deductible expenses (mortgage interest, property taxes, insurance, repairs, depreciation, management fees, and travel). Depreciation is a non-cash deduction that reduces taxable income without affecting actual cash flow, often creating a tax loss on paper while generating positive cash flow.
Question: Can you have negative cash flow and still make money? Yes, you can have negative cash flow and still profit through appreciation and principal paydown. However, this strategy is risky—during the 2008 downturn, properties with negative cash flow for 3+ years saw foreclosure rates of 25% compared to 5% for positive cash-flow properties. I recommend avoiding negative cash flow unless you have substantial reserves.
Question: What percentage of rental income should go to expenses? Operating expenses (excluding mortgage) should consume 40-55% of gross rental income. The 50% rule is a good starting point: budget 50% for all operating expenses, then the remaining 50% covers your mortgage and provides cash flow. Properties in better condition and newer construction tend toward 40-45%.
Question: How does inflation affect rental property cash flow? Inflation typically benefits rental property owners because rents rise with inflation while fixed-rate mortgage payments remain constant. During the 2021-2023 inflationary period, landlords who raised rents 5-8% annually saw cash flow increase 15-25% as their largest expense (mortgage) stayed flat.
Question: What is the best way to track rental property cash flow? The best approach combines automated software like Stessa or QuickBooks for daily tracking with a custom spreadsheet for scenario analysis. Track income, expenses, and vacancy monthly, and review cash-on-cash return quarterly. For tax purposes, maintain separate bank accounts for each property and use accounting software that categorizes expenses correctly.
About the Author
Michael Torres, CPA is a Certified Public Accountant specializing in personal tax strategy with 12+ years of experience advising real estate investors on portfolio optimization and tax-efficient wealth building. He has helped over 500 clients structure their rental property investments for maximum cash flow and minimum tax liability. Michael is a member of the American Institute of CPAs and the National Association of Real Estate Investors.
This article is for educational purposes only and does not constitute financial advice. Real estate investments carry risk, and past performance does not guarantee future results. Consult with a qualified financial advisor or tax professional before making investment decisions.
Last updated: July 15, 2026